Workspace tour
Where everything lives in the app, what each page is for, and who in your workspace can do what.
The header
The bar along the top is the same on every page.
- Workspace switcher. Pipelines, connections, models, charts and dashboards all belong to a workspace. Switch between yours here, or create another.
- Ask rsync.aiopens the assistant on the page you're on, when Ask rsync.ai is switched on. The shortcut is
⌘/(Ctrl+/on Windows and Linux); in the SQL editor,⌘/comments a line instead. See Ask rsync.ai. - Theme toggle, notifications (the bell) and your account menu.
The sidebar
Pages are grouped by what you're doing. Home and Runs sit at the top; the rest are in four groups.
| Group | Page | What it's for |
|---|---|---|
| — | Home | Opens on Ask rsync.ai when it's on (otherwise on Create a pipeline), with what needs attention and how your pipelines have been running. |
| — | Runs | Every run of every pipeline, model and workflow in one list. |
| Build | Pipelines | Move data from a source to a destination, including CDC. See Data pipelines. |
| Build | Models | A saved query that keeps a table up to date. See Models. |
| Build | Workflows | Checks and messages on a schedule. See Workflows. |
| Analyze | Dashboards | Charts and text on one page, with filters. See Dashboards. |
| Analyze | Charts | Saved charts drawn from a model or a saved query. See Charts. |
| Analyze | Explorer | Run SQL against a connection. See Explorer. |
| Data | Lineage | Which pipelines write which tables, and which models read them. |
| Data | PII Management | Personal data that scans found, and how it's protected. |
| Data | Connections | The sources and destinations you've connected. |
| Data | Connectors | The catalog of connectors, including ones built by AI. See AI connectors. |
| Manage | Workspace | Members, roles, and workspace settings. |
| Manage | Usage | What this workspace has used against your plan. |
| Manage | Settings | Your own account, alerts and appearance. |
Runs
One list for everything that ran. A pipeline run, a model rebuild and a workflow run each appear here with their status, so a problem in a chain is visible in one place. Times are shown in your browser's time zone.
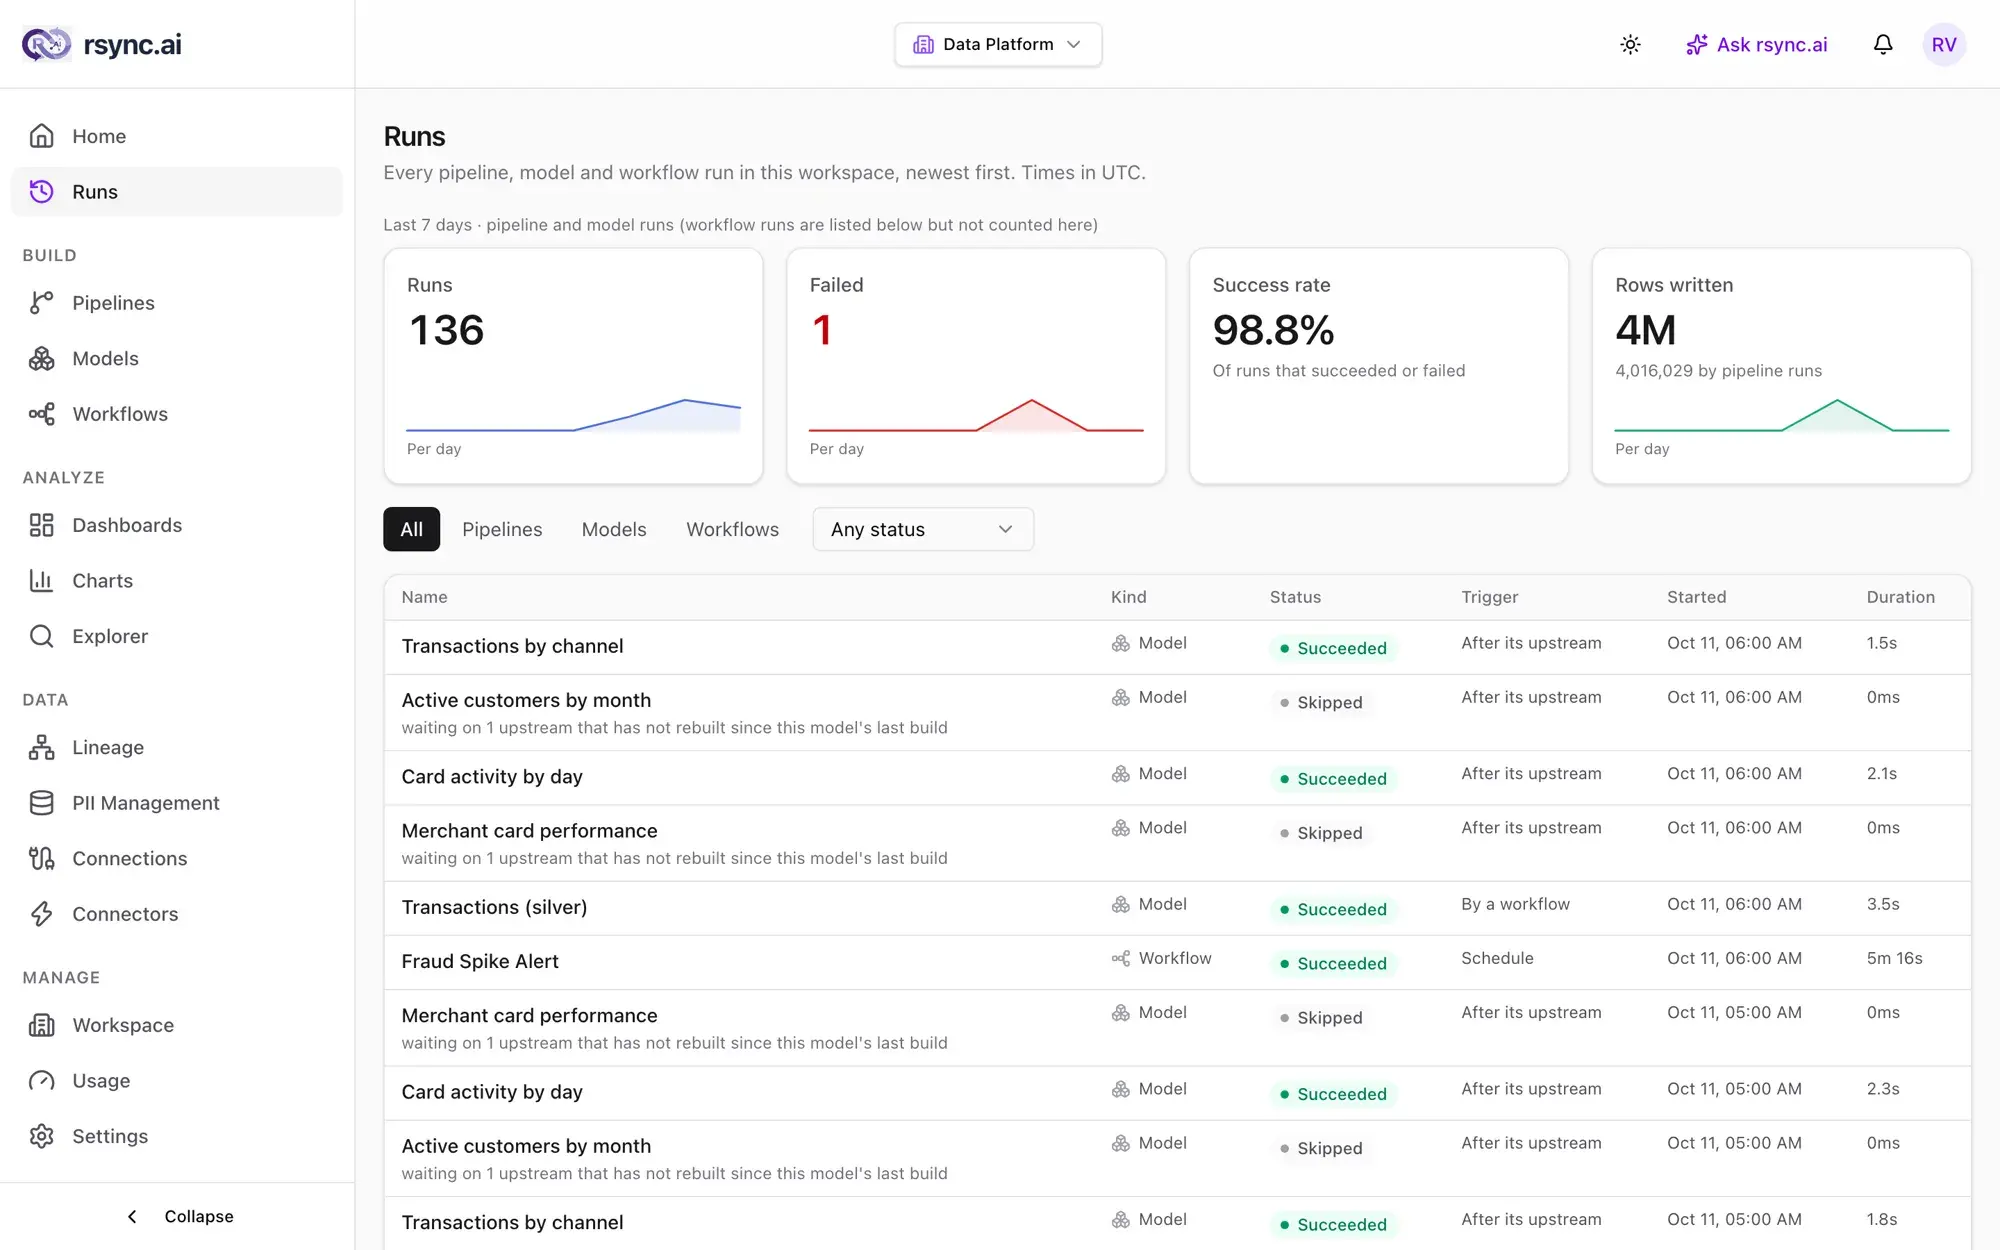
- The cards at the top cover the last 7 days.
- Workflow runs are listed so you can see them, but aren't counted in the pipeline and model totals.
Lineage
Lineage draws how data flows through the workspace: which pipelines write which tables, which models read them and which models read other models. Use it before you change or remove something, to see what depends on it.
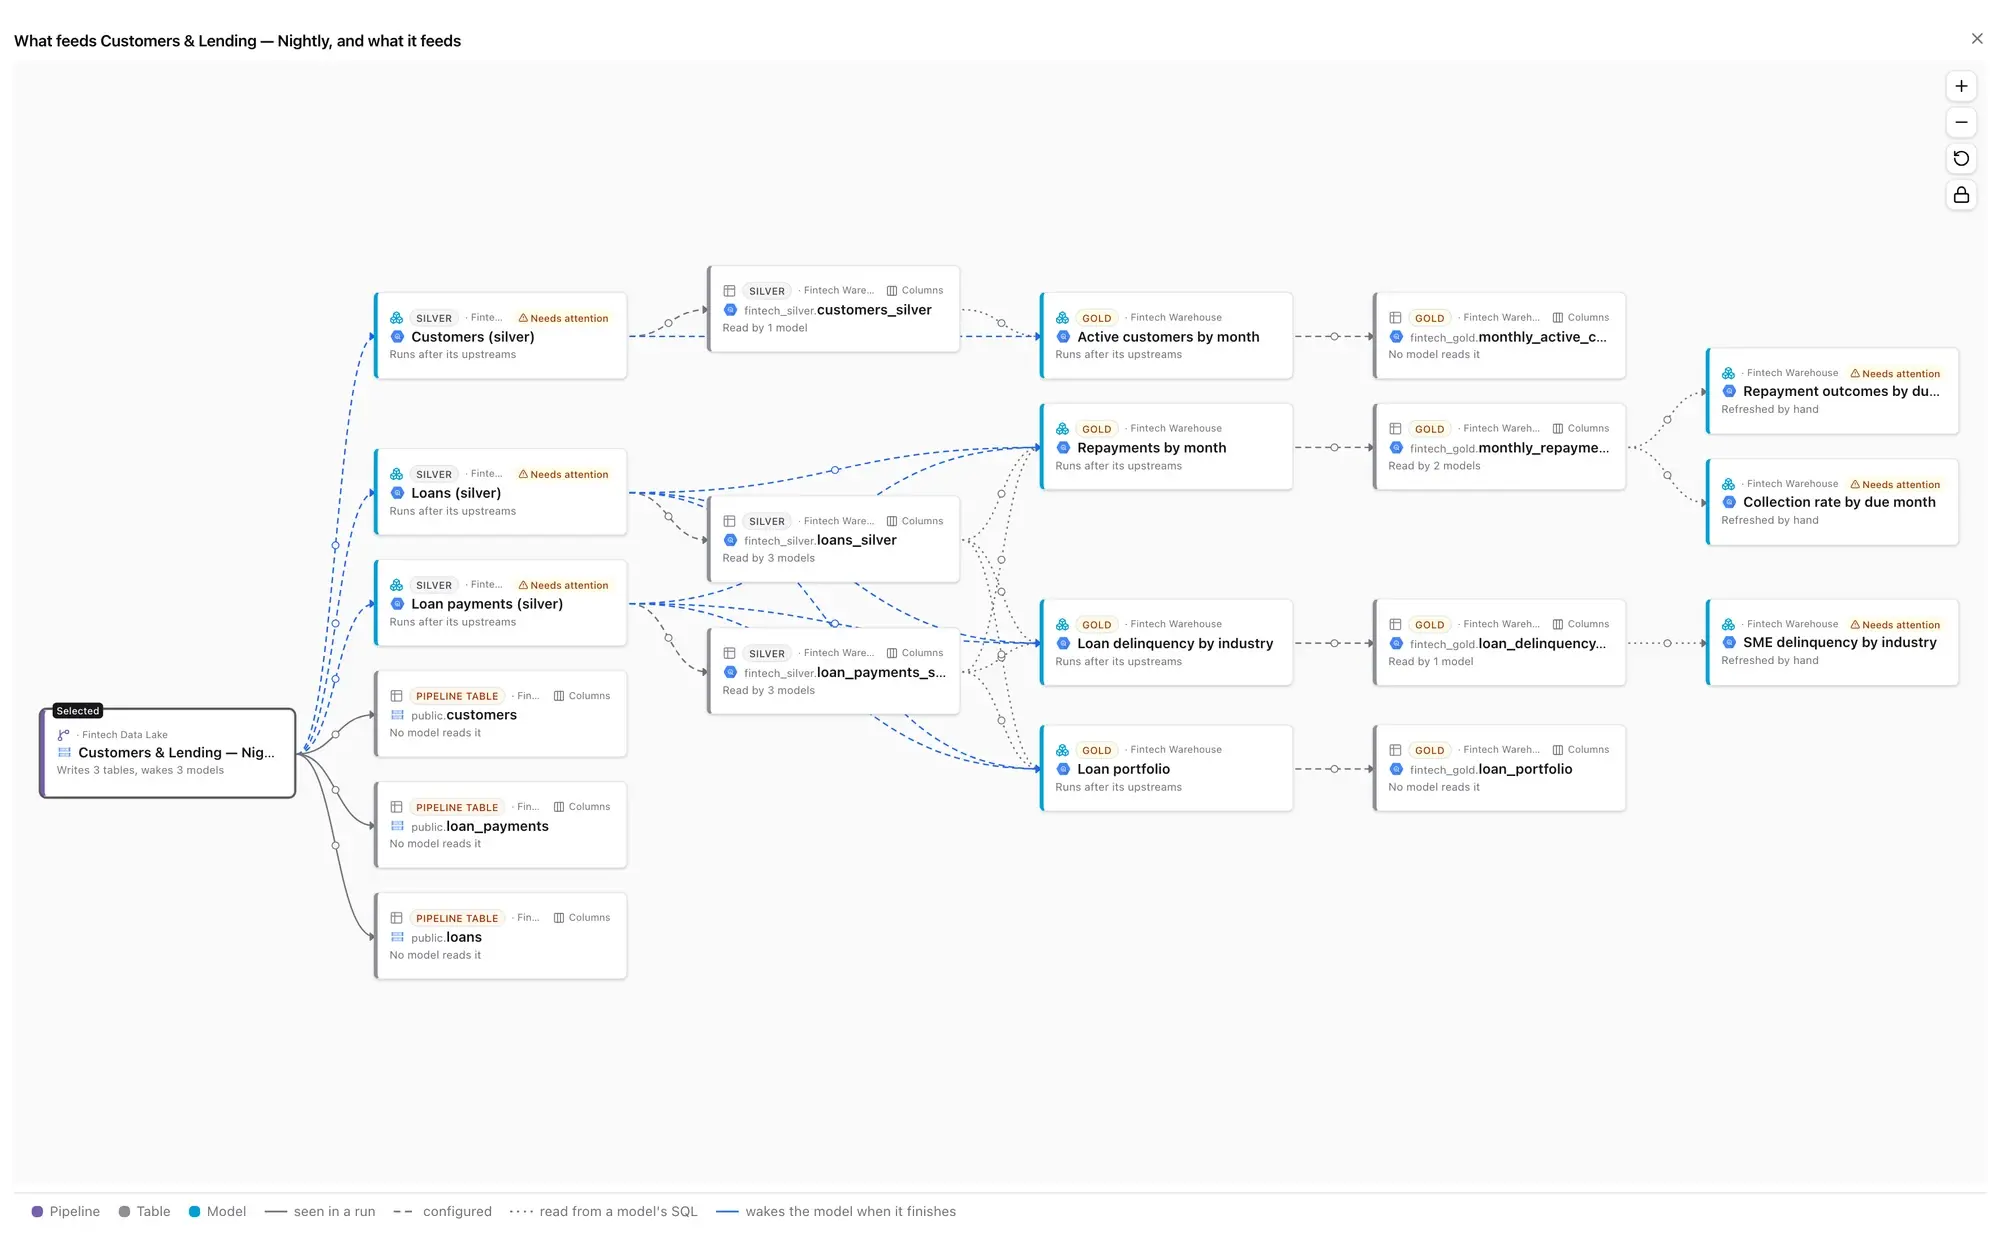
- Graph or list. Switch between the two, and filter by warehouse.
- Needs attention. Lists things that look wrong, such as a model that is refreshed by hand even though it reads something that is refreshed on a schedule.
- Layers show as badges. Silver and gold models are marked on the graph. See Bronze, silver and gold.
- Dashboard tiles link here. The Lineage link in a tile's About this chart opens its model on this graph.
PII Management
This page is for detecting, protecting and managing personally identifiable information. A scan flags columns that look personal, and pipelines can mask them on the way through.
| Tab | What it shows |
|---|---|
| Overview | How many columns scans found and how many are masked, with charts of scanned columns by type and of how masked columns are protected. |
| Approvals | Requests to move personal data unmasked. They wait here for an admin, who can approve or deny each one. |
| Policies | The masking policies for the workspace. |
| Hash functions | The functions a mask can hash with. |
The same detection drives masking in the Explorer, where personal columns are masked in a preview.
Usage
Usage shows this workspace's consumption against your plan limits: your plan, how many pipelines you have, and how much data you've moved this month. It also shows rows read, rows written and records processed, a chart of rows written per day, and the pipelines that wrote the most.
Workspace settings
Workspacein the Manage group opens the settings for the workspace you're in. Your role shows beside the title. If your access is read-only, the page says so.
| Tab | What you do there |
|---|---|
| General | Rename the workspace or leave it. |
| Members & invitations | Invite teammates and change or remove members. The owner deletes the workspace here. |
| Roles & permissions | A read-only table of what each role can do. |
| Data | Workspace-level data switches, and how long saved-query version history is kept. One switch allows Ask rsync.ai sample rows, and it is off by default. |
| Model layers | Add, name and order the bronze, silver and gold layers. See Models. |
| Delivery channels | The Slack and email destinations that workflows send to. |
Roles
Every member has one of four roles in a workspace. A higher role can do everything a lower one can. The server checks the role on every action, so a hidden button is never the only thing standing in the way.
| Role | Can |
|---|---|
| Viewer | Read connections, pipelines and runs. Open dashboards and pick their filters. |
| Member | Create and run connections and pipelines, and save queries. |
| Admin | Everything a member can, plus invite and manage members, rename the workspace, run SQL that writes, schedule and run models, generate connectors, and make charts, dashboards and workflows. |
| Owner | Everything an admin can, plus destructive SQL such as DROP and TRUNCATE, deleting the workspace and transferring ownership. |
Ready to try it?
Start building on rsync.ai Cloud today — or self-host on your own infrastructure.