Dashboards
A dashboard puts saved charts and text on one page, with filters. Everything is read live when it opens, as the person looking.
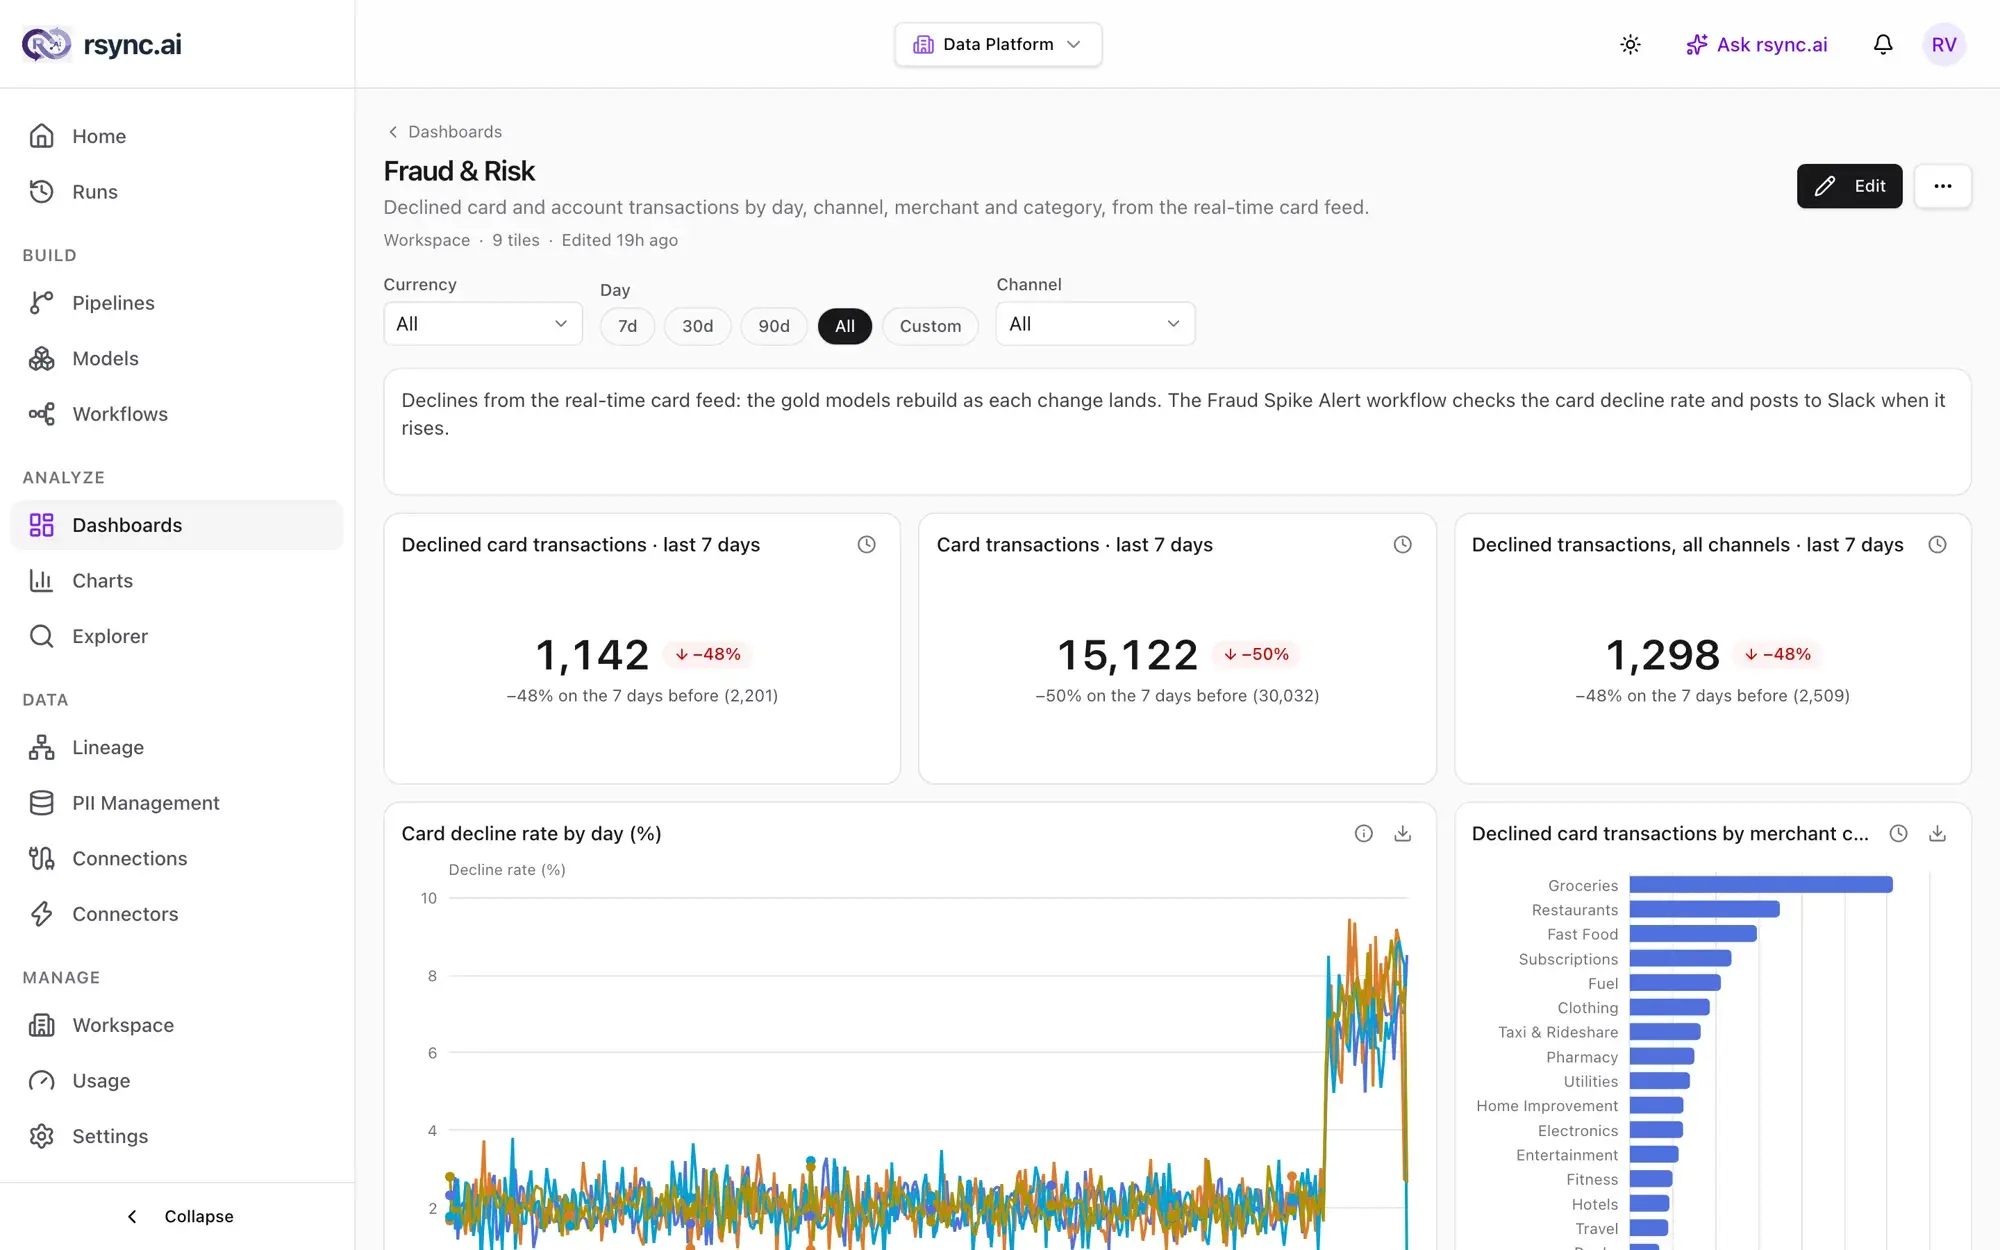
Make a dashboard
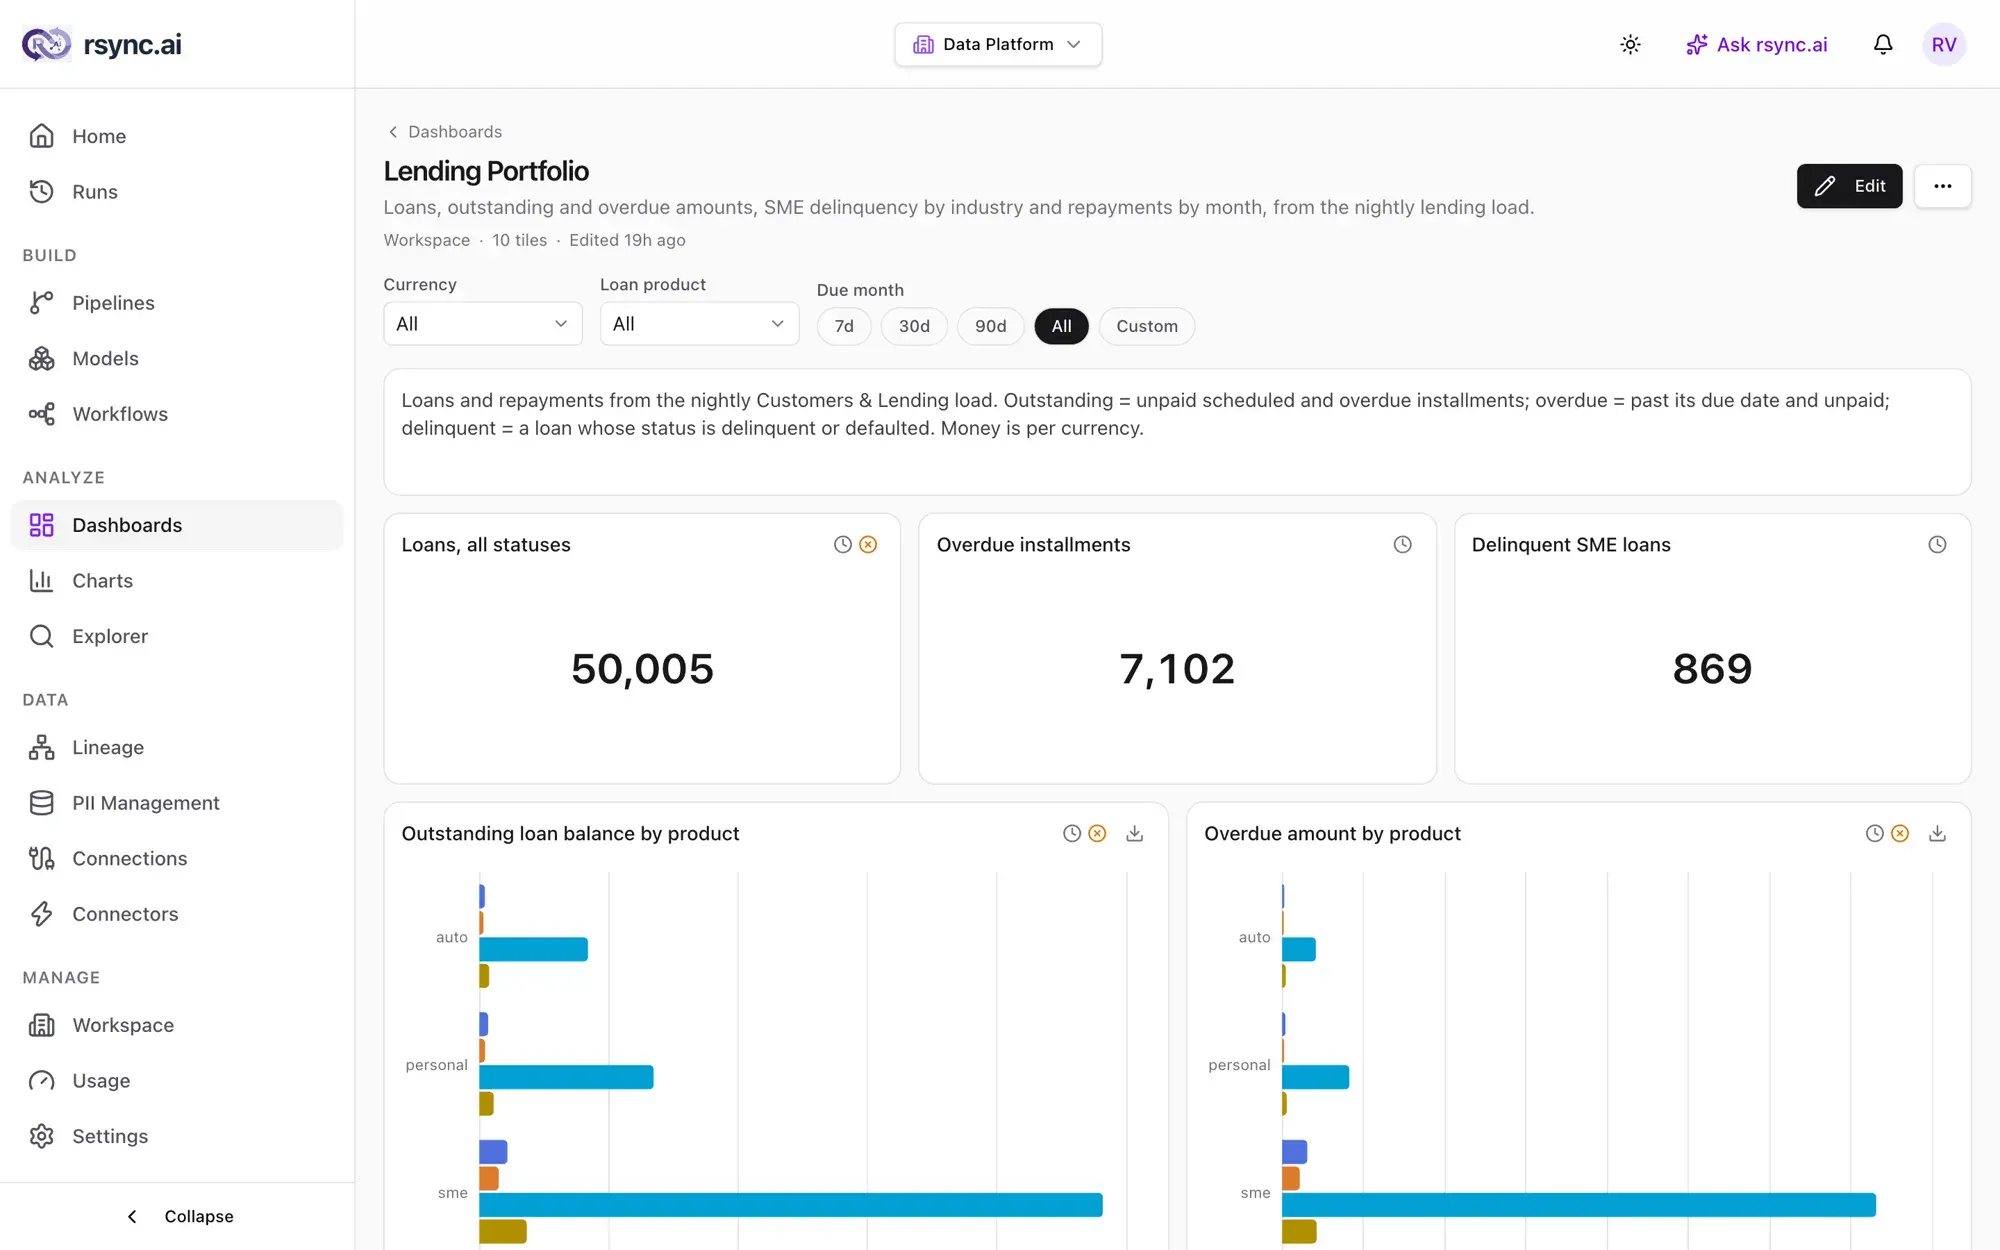
Open Analyze → Dashboards → New dashboard. Add saved charts and text, drag a tile by its handle, and add filters. Select Save dashboard to save the whole page. A dashboard has at most 30 tiles.
Sizing:drag a tile's right edge, bottom edge or corner, with the 12 columns shown while it moves, or pick a width from the ↔ button in its header: full, ¾, ½, ⅓ or ¼ of the row. The tiles in its way move down.
Filters
A dashboard has up to 4 filters.
| Filter | Behaviour |
|---|---|
| Date range | Filters a date column. Pick the last 7, 30 or 90 days, All, or Custom. Custom applies once both days are picked. |
| List of values | Filters a column to the values you tick. The list is read live, up to 200 values; type any other. Pick up to 50. A masked column lists nothing, so type the values instead. |
- A filter applies to each chart whose source has that column. Any other chart, or one whose connection can't take a filter, says it isn't filtered by it.
- Values you pick are sent as bound parameters, never pasted into the SQL.
What a tile tells you
Every tile is read live when the dashboard opens. Nothing is copied or cached. The icon button in a chart tile's header opens About this chart. For a chart built on a model it shows:
| Item | Means |
|---|---|
| Data as of | When the rows were current: the CDC position its last good run read, or when that run finished. |
| On time / Overdue | Whether the model met its freshness deadline, if it has one. |
| Checks n of m passed | Its data checks on that run, each listed. |
| Lineage | Opens the model on the lineage graph. |
Every chart says when it was read. A failed run, an overdue model or a stopped run shows as a warning count on that button, and the chart is still drawn from the rows there are.
Draft and change with Ask rsync.ai
Draft:ask for “a sales dashboard from the daily orders query, with a date filter”. A card under the answer lists the charts and filters it drafted, with Preview, Who sees it and Save dashboard. A draft can hold up to 12 charts and 4 filters, and is kept for 24 hours. Only owners and admins can draft one, and nothing (its new charts included) is saved until you select Save dashboard.
Change one tile:on an open dashboard, ask “make the orders chart a line” or “make the first chart full width”. The card shows the tile before and after, with what changes marked and the tiles that move down. Select Apply change. For two tiles, ask for two changes.
- A chart used only on this dashboard is changed in place. If it's on another dashboard too, it's copied for this tile, and the card says how many other dashboards use it. Restore can't undo a chart changed in place.
- If the dashboard or chart was saved after the change was drafted, the card says it's out of date. Ask again.
- The model sees the sources' column names and kinds and the charts' settings, never a row.
metadata:read and dashboards:write. You save or apply the draft in rsync.ai. See the agent gateway.History and restore
History on an open dashboard lists its versions, newest first. Every save keeps the dashboard as it was before, with who saved it and how: an edit, a change from Ask rsync.ai, or a restore. Select a version to see its name, filters and tiles.
- Restore this version asks first. The dashboard as it is now is kept as the next version, so a restore never deletes one.
- A restore puts back the name, filters and tiles. Each chart is drawn with its settings as they are now, and who sees the dashboard stays as it is.
- Versions hold no rows and are kept as long as the dashboard is.
Sharing, export and email
A dashboard is Only me or The workspace. Owners and admins make and change dashboards; members and viewers open them and pick filters. Charts read with the viewer's rights, so a masked column stays masked.
From the … menu, select Export PDF for an A4 landscape PDF with the filters you picked. To email one on a schedule, select Schedule email (owners and admins, where Ask rsync.ai is on). It opens Ask rsync.ai to draft a workflow with a dashboard step, which you review and save.
Ready to try it?
Start building on rsync.ai Cloud today — or self-host on your own infrastructure.